Network Measurements
Why?
While network verification helps ensuring reachability, it does not (always) guarantee it in practice.
It does not always scale
- might not be able to verify large-scale networks
It only verifies properties according to a formal model
- does not capture everything, e.g. runtime issues
It only works within a network
- yet, all networks on the path need to be correct
What?
A network connection is characterized by its delay, loss rate, and throughput.
How long does it take for a packet to reach the destination?
What fraction of packets sent to a destination are dropped?
At what rate is the destination receiving data from the source?
These are only network-level metrics though. In practice, measurements are pervasive across the entire stack.
| Layer | What we measure |
|---|---|
| Application | Quality of experience |
| Transport | TCP parameters, completion times, fairness metrics, … |
| Network | Delay, loss, throughput, routing tables, end-to-end paths, … |
| Link | Interface metrics (e.g. buffer space, error rates) |
| Physical | Signal-to-Noise ratio, power consumption, … |
Who?
Many entities measure different aspects of the network, and for different purposes. For example,
- Applications:
- server selection, bitrate adaptation
- End users:
- debugging, SLA verification
- Intermediate networks:
- debugging, SLA monitoring, capacity planning
- Researchers:
- protocol architecture, infrastructure design, network mapping
Different entities differ in:
| 1. number of vantage points they can directly run measurements from. | 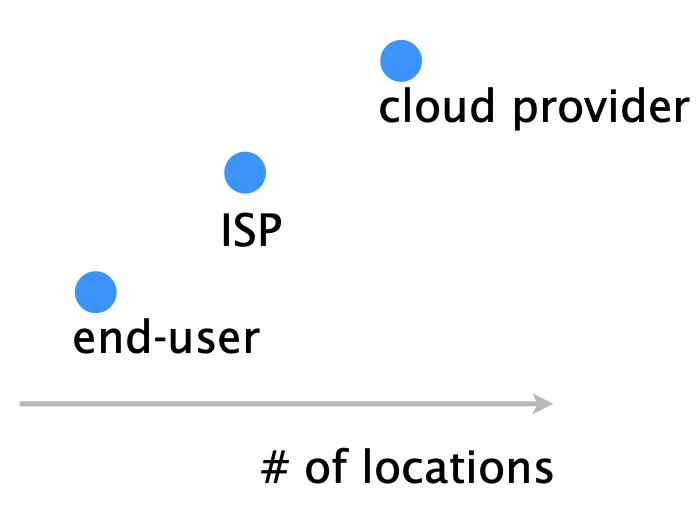 |
| 2. number of layers they can directly measure/observe. | 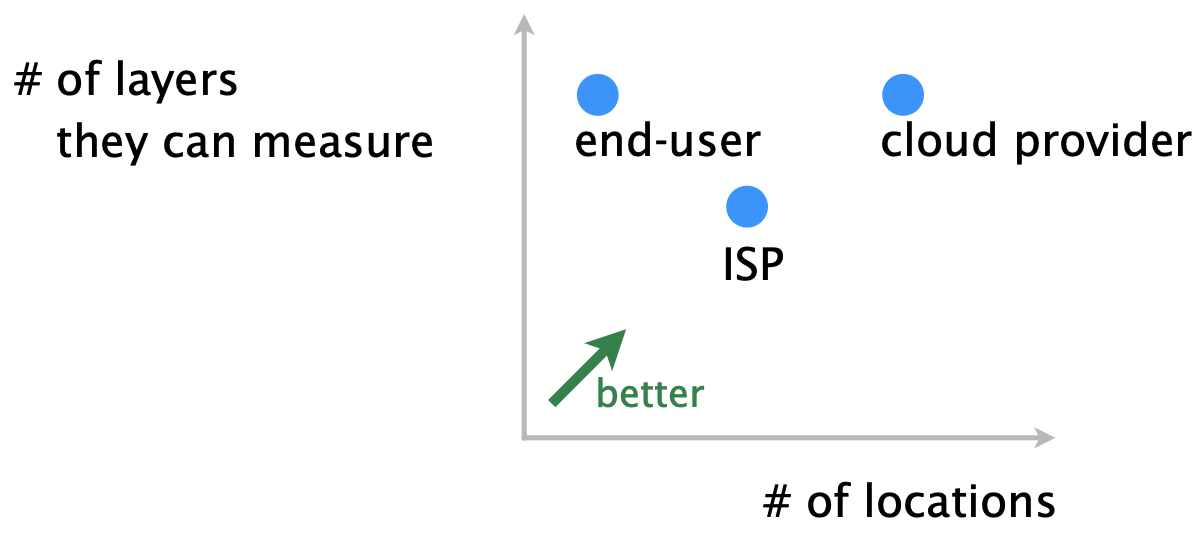 |
How?
Different measurement tools exist depending on the property of interest, such as:
(h)ping | traceroute | iperf(3) | dig/nslookup | tcpdump |
netstat | ss | ifconfig | route | bgpdump |
snmp | netflow/sFlow |
Large-scale measurement platforms allow you to run and/or collect measurements from a large set of vantage points.
Problems
We’ll now focus on two fundamental (tend to happen independently of the measurement tasks, tools, or platforms) problems in network measurements.
| Problem | Solution | |
|---|---|---|
| #1 | There is too much data to export, store, and process | Approximate |
| #2 | There is not enough data to accurately measure property x | Infer… while maintaining accuracy |
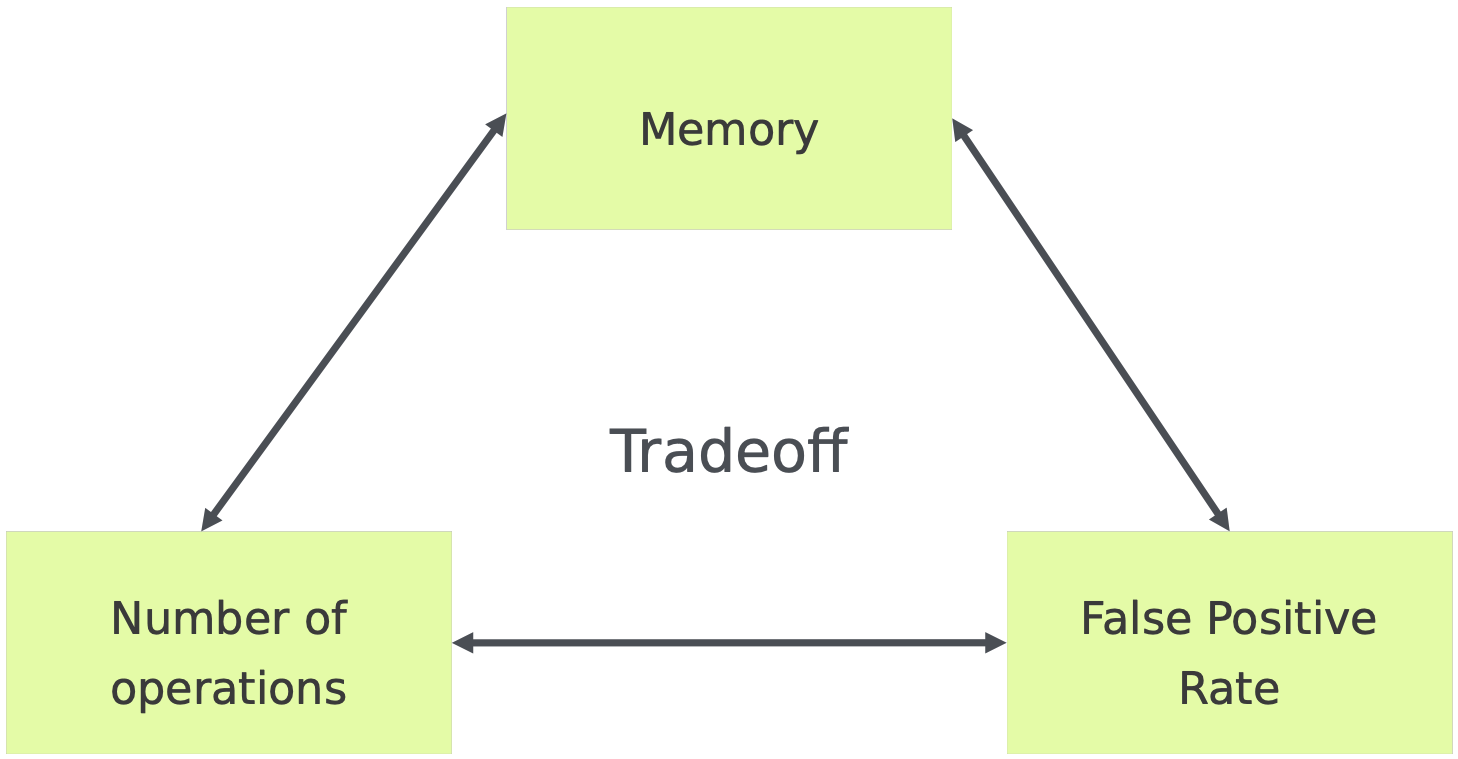
We’ll look at probabilistic data structures that enable to trade accuracy for memory, in a controlled way.
Applications of knowing the Internet topology
Knowing the Internet topology has plenty of useful applications: 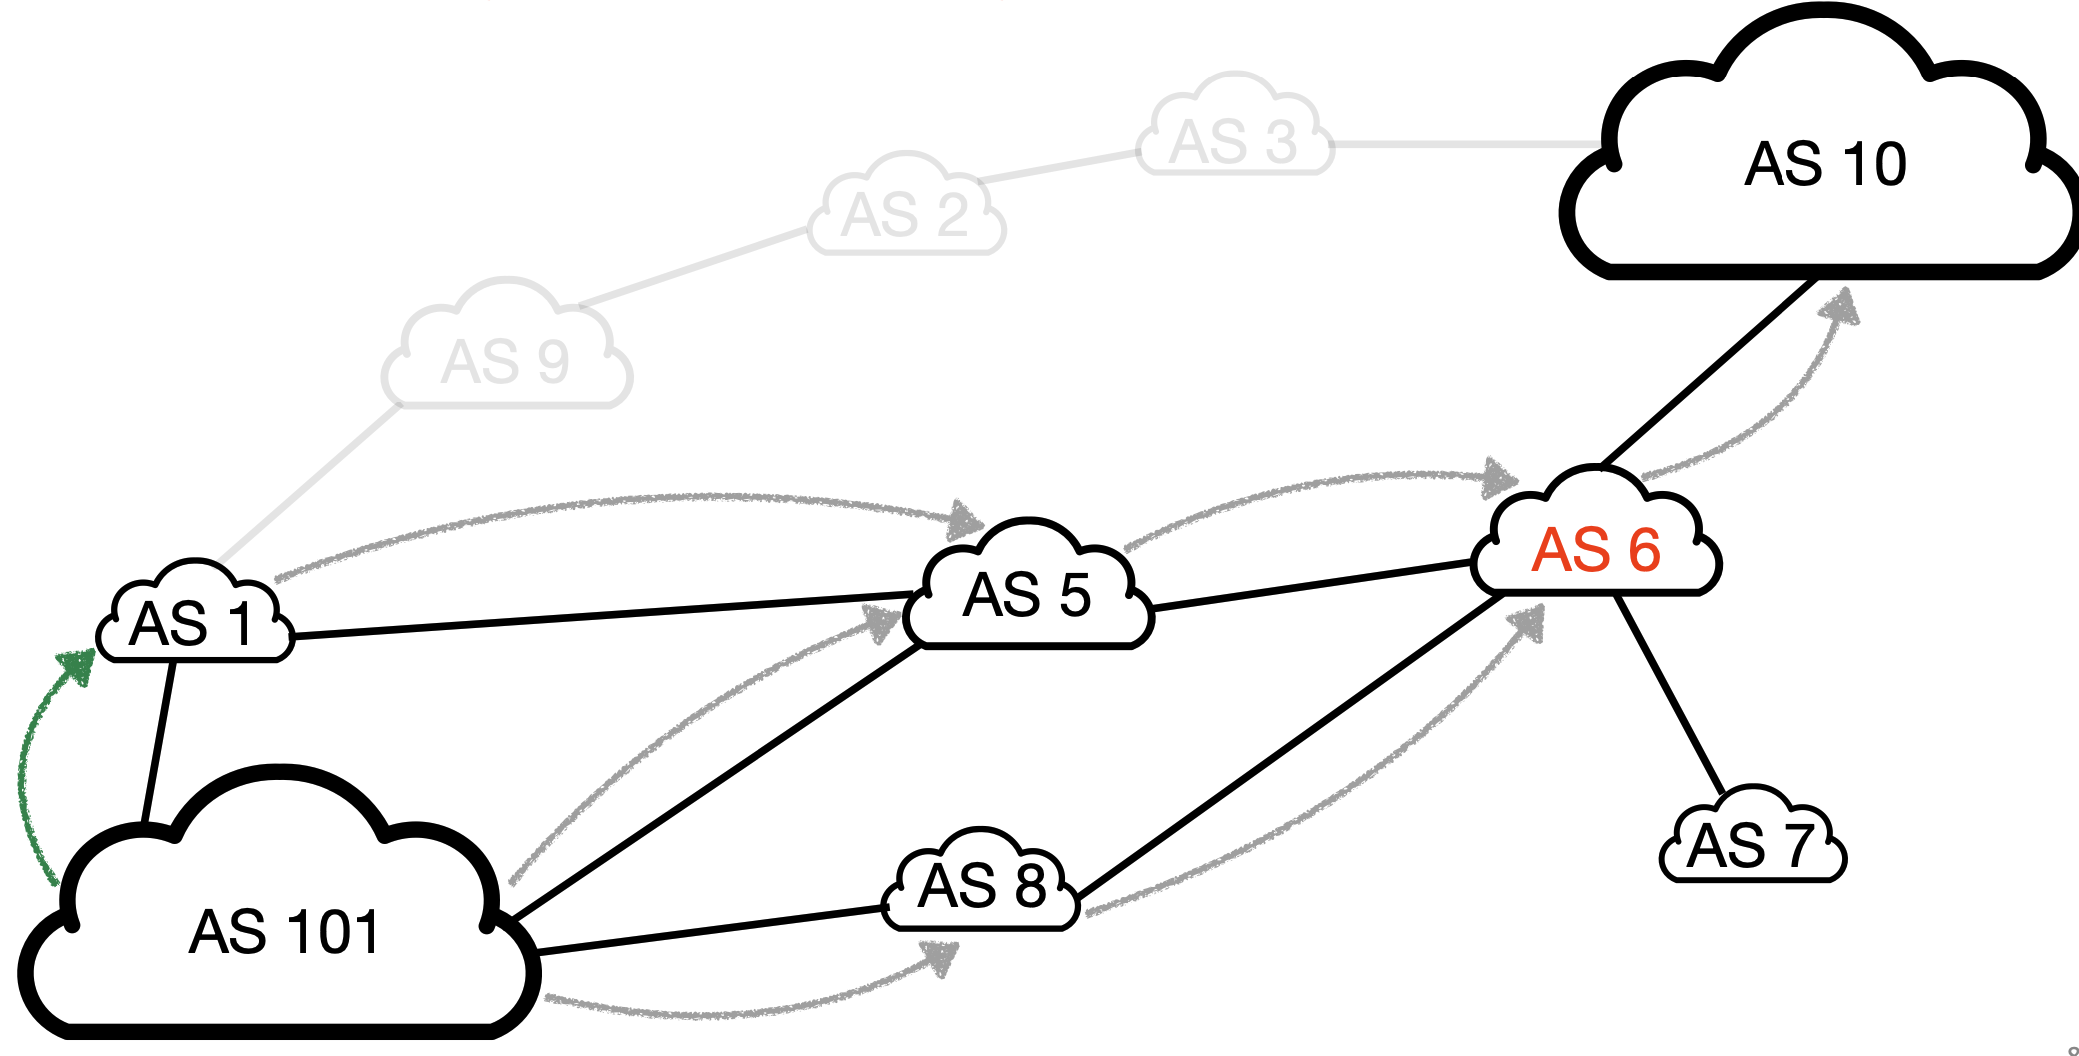
| Property | Investigation | Examples |
|---|---|---|
| Performance | How does my client’s traffic reach me? How should I change my policy to improve performance? | CDNs want their clients to use performant paths, The CDN doesn’t know which routes will its clients select |
| Security | Is this a valid BGP route origin and path? Is this path compliant with the policies of en-route ASes? | Is the route [6,7] legit for reaching AS101’s prefixes? |
| Reliability | Are my routes sharing a single point of failure? Do I have enough redundancy for my customers to reach me? | AS6 is a single point of failure though… |
| Privacy | Does this route pass through a country I do not want? How should I change my policy to improve my privacy? | AS101 doesn’t want its traffic to cross the country in which AS6 is located |
Knowing the annotated Internet topology has plenty of applications, but directly measuring such a topology is impossible.
- There is no central authority in the Internet
- each AS is free to do as it pleases
- ASes have no incentives sharing their policies
- think of them as trade secret
- The Internet topology is huge and ever-changing
- even if we could measure it, it would be too costly
What we do have though are the BGP routes seen on a few hundreds of BGP sessions scattered around the globe, such as the RIPE RIS dataset and the Routeviews dataset.
Locating performance issues from end-to-end measurements
Not all links in the Internet perform adequately:
| “lossy” links in orange “non-lossy” links in green | 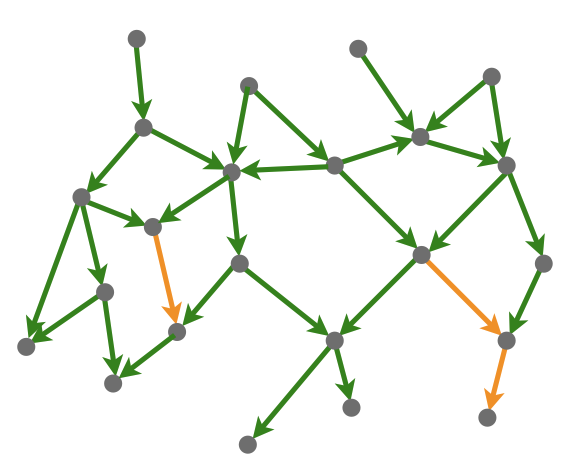 |
- As user traffic crosses these links, their performance degrades.
- Upon experiencing performance issues, can users precisely locate which links are the culprit?
- One could try using tools like traceroute
- but… ISPs may not reply to traceroute packets
- One could try inferring the problematic links from the observed performance
Approximating Measurements
You are looking at a stream of data. There are many questions you might ask: in networking, we usually talk about streams of packets, but these questions apply to other domains as well, e.g. search engines and databases.
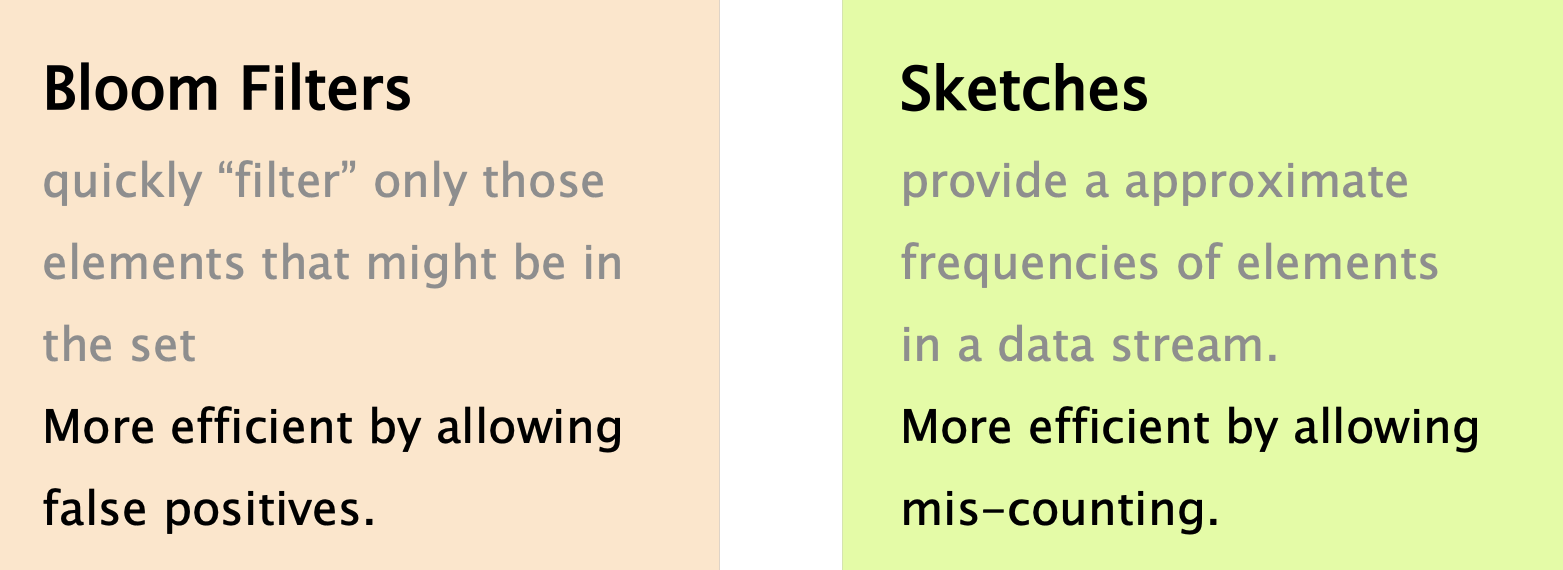
- Is a certain element (e.g. ip address) in the stream?
- Bloom Filter
- How frequently does an element appear?
- Count Sketch, CountMin Sketch, …
- How many distinct elements are in the stream?
- HyperLogLog Sketch, …
- What are the most frequent elements?
There are two common strategies to implement a set:
| strategy #1 | strategy #2 | |
|---|---|---|
| output | Deterministic | Probabilistic |
| number of required operations | Probabilistic | Deterministic |
Separate-chaining
| With N elements and M cells, we’ll have a list size of $\frac N M$ in average, and of $N$ in the worst-case. Pros: accurate and fast in the average case. Con: only works in hardware if there is a low number of elements (e.g. $< 100$). | 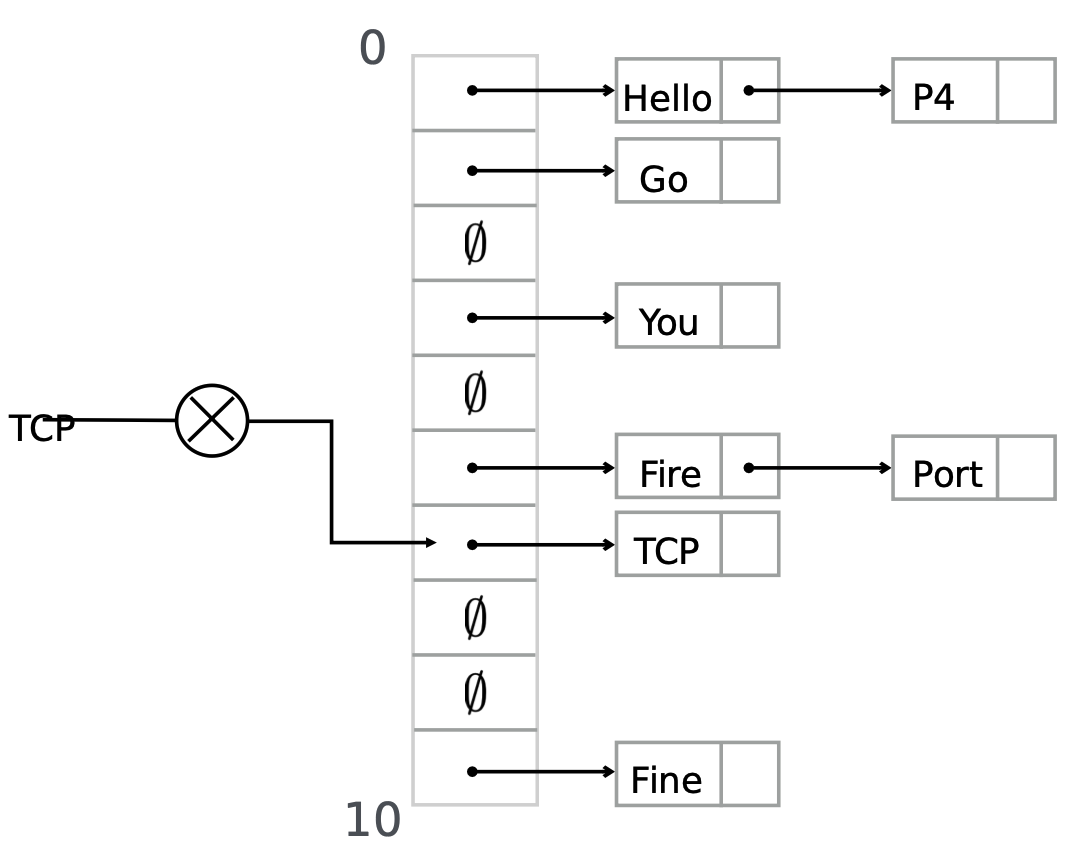 |
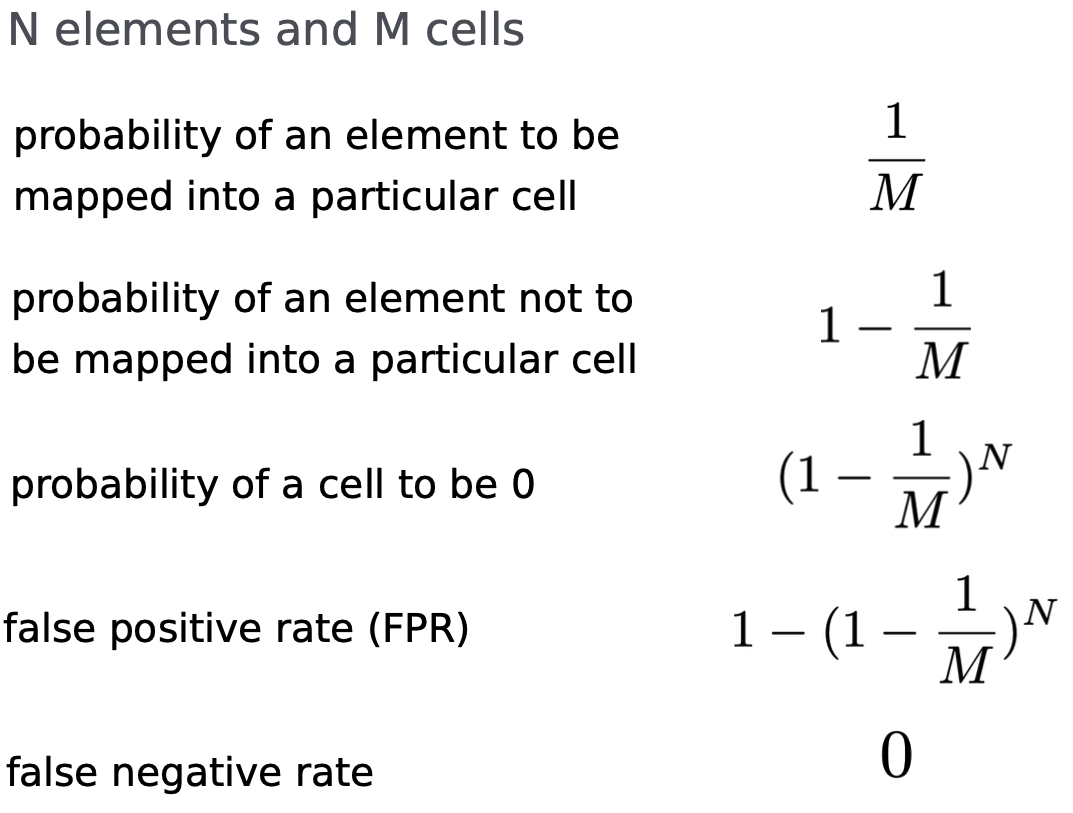
Probabilistic Data Structures
Pros: simple and only one operation per insertion or query.
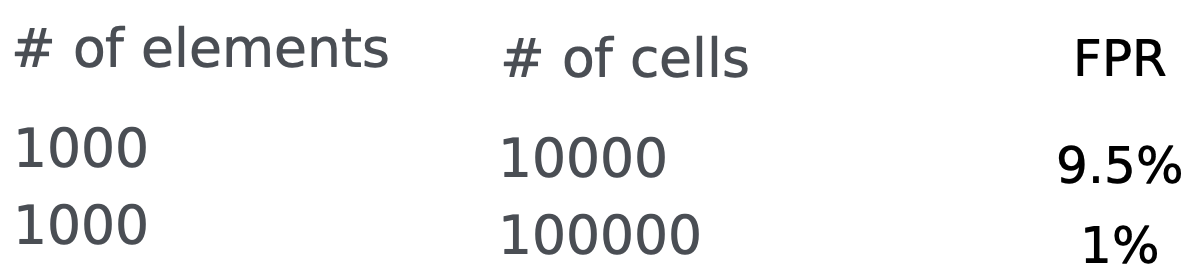
Con: roughly $100$x more cells are required than the number of element we want to store for a 1% false positive rate.
 |  |
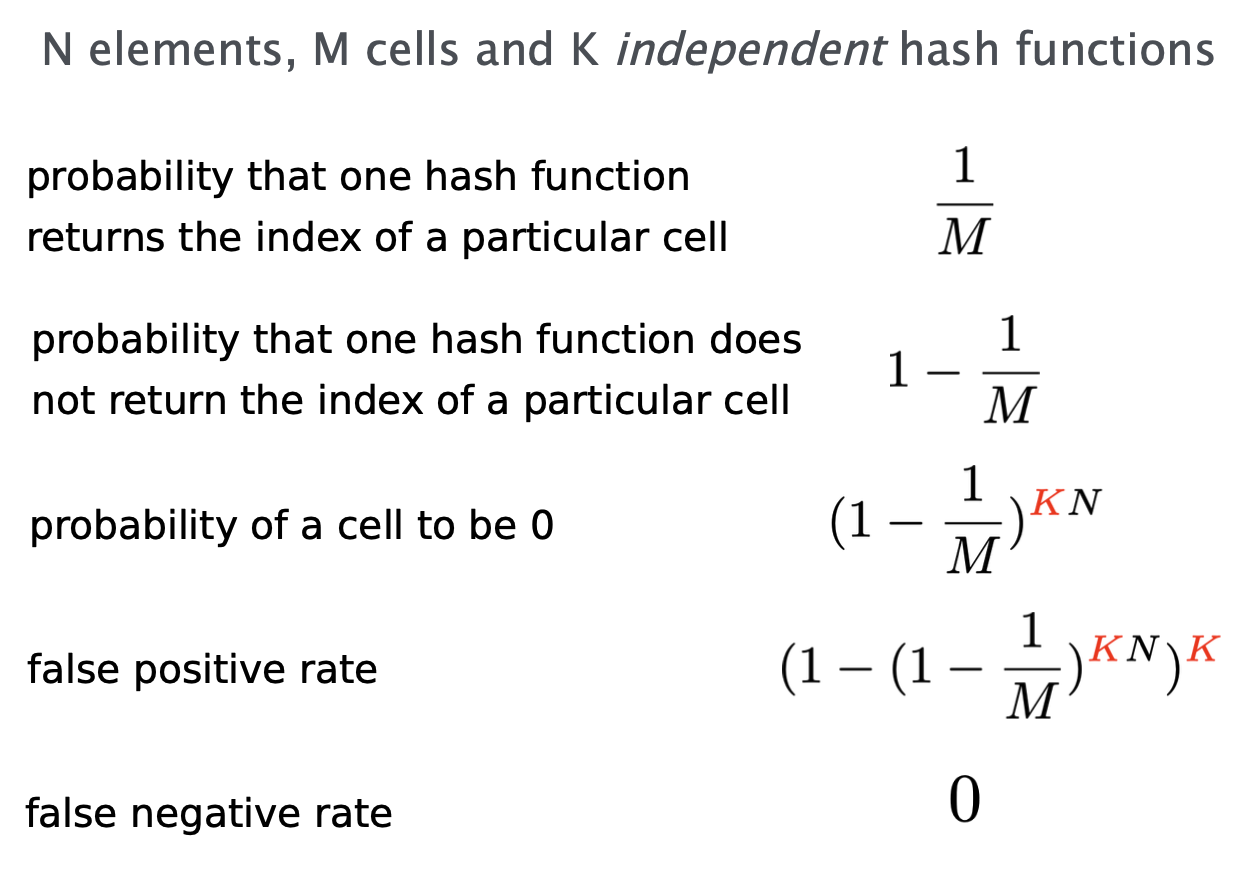
Bloom Filters
Idea: use multiple hashes at the same time.
- An element is considered in the set if all the hash values map to a cell with 1
- An element is not in the set if at least one hash value maps to a cell with 0
Pro: consumes roughly 10x less memory than the simple approach.
Con: Requires slightly more operations than the simple approach (7 hashes instead of just 1).
 | 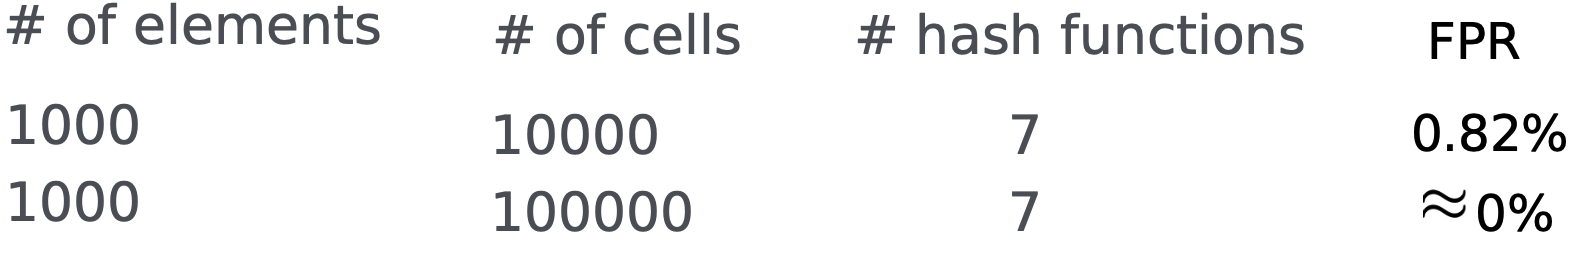 |
Dimension your Bloom Filter
$N$ elements, $M$ cells, $K$ hash functions, $FP$ false positive rate
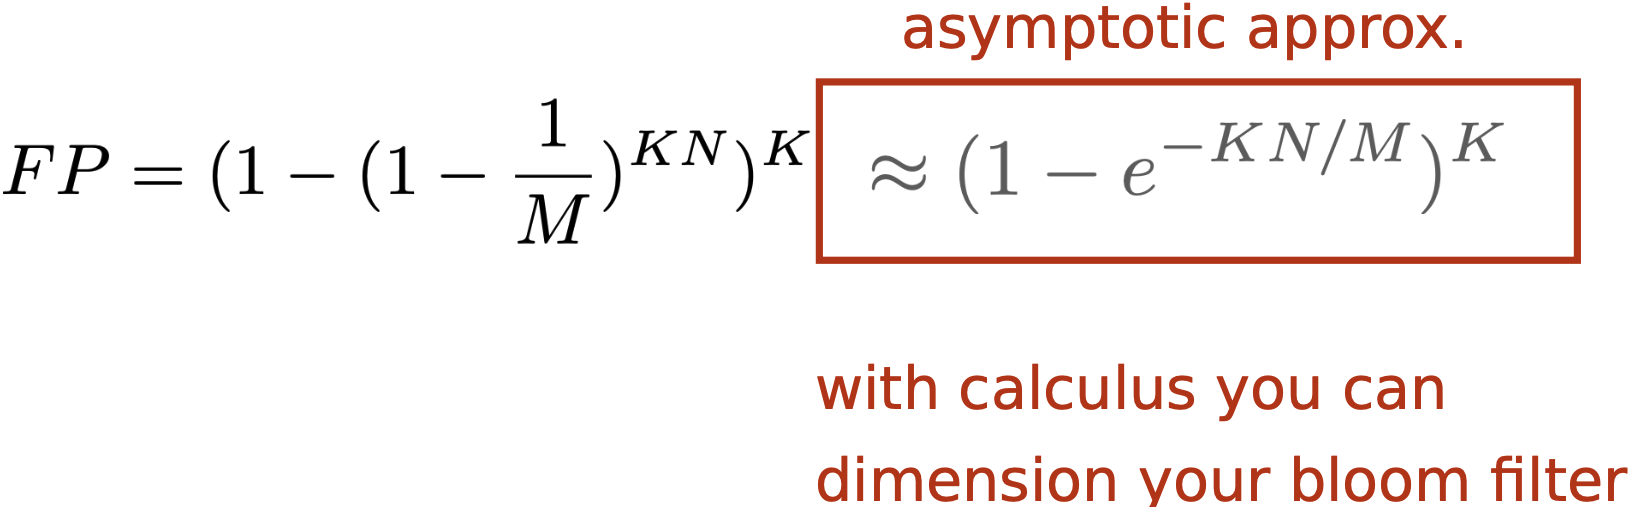 | 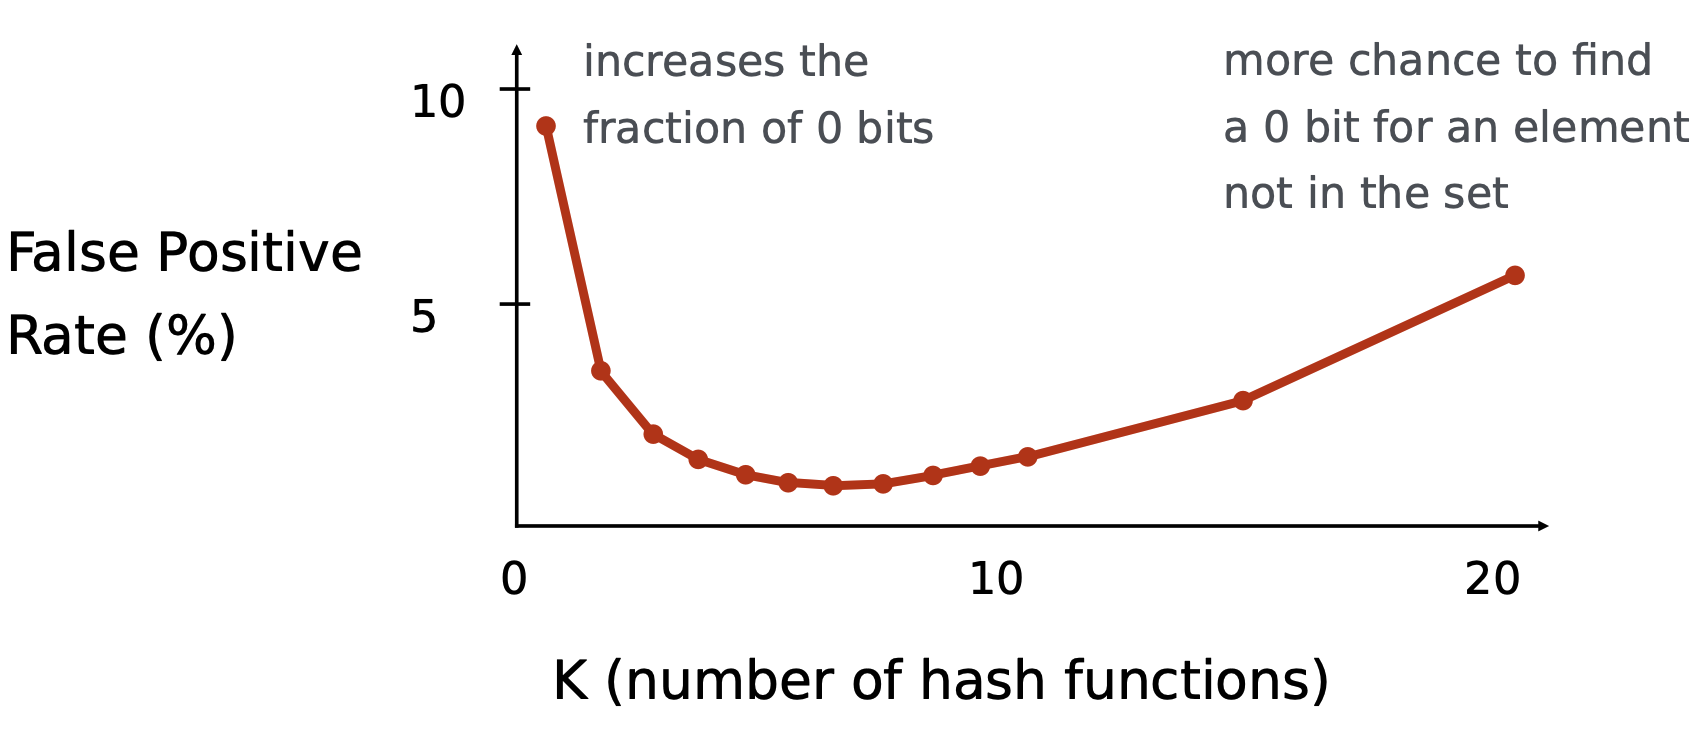 |
There is always a global minimum when $K=(\ln (2))(\frac M N)$ found by taking the derivative of $\approx (1-e^{-K \frac N M} )^K$
Implementation
- Depending on the hardware limitations, splitting the bloom filter might be required.
- $M$ cells are split into $\frac M K$ disjoint groups
- An element is hashed to $K$ cells, one in each group
- One hash function per group
- About same performance, may be easier to implement or parallelize
Because deletions are not possible, the controller may need to regularly reset the bloom filters. Resetting a bloom filter takes some time during which it is not usable.
Common trick: use 2 bloom filters and use one when the controller resets the other one.
Bloom filters may be extended to allow deletions and to list the filter content.
CountMin Sketch
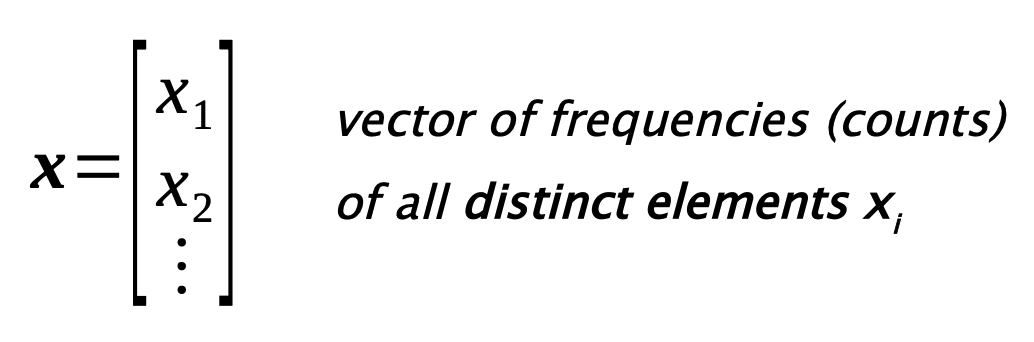
How frequently does an element appear? We are going to look at frequencies, i.e. how often an element occurs in a data stream.
| In the worst case, an algorithm providing exact frequencies requires linear space. | 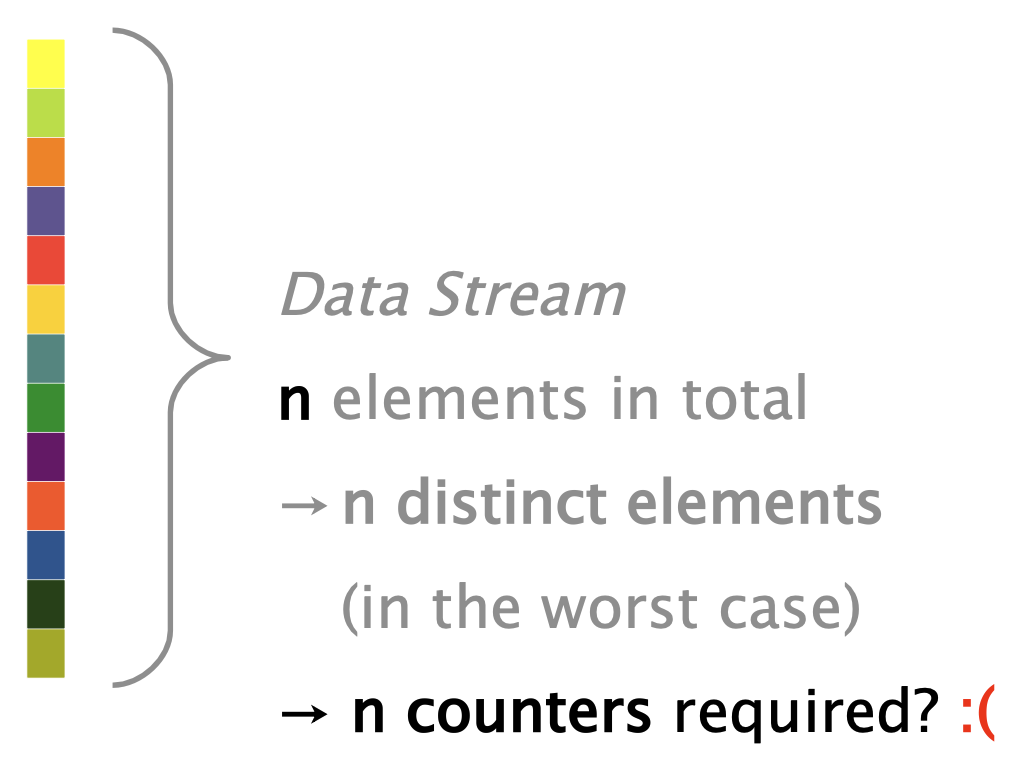 |
Probabilistic data-structures can help again!
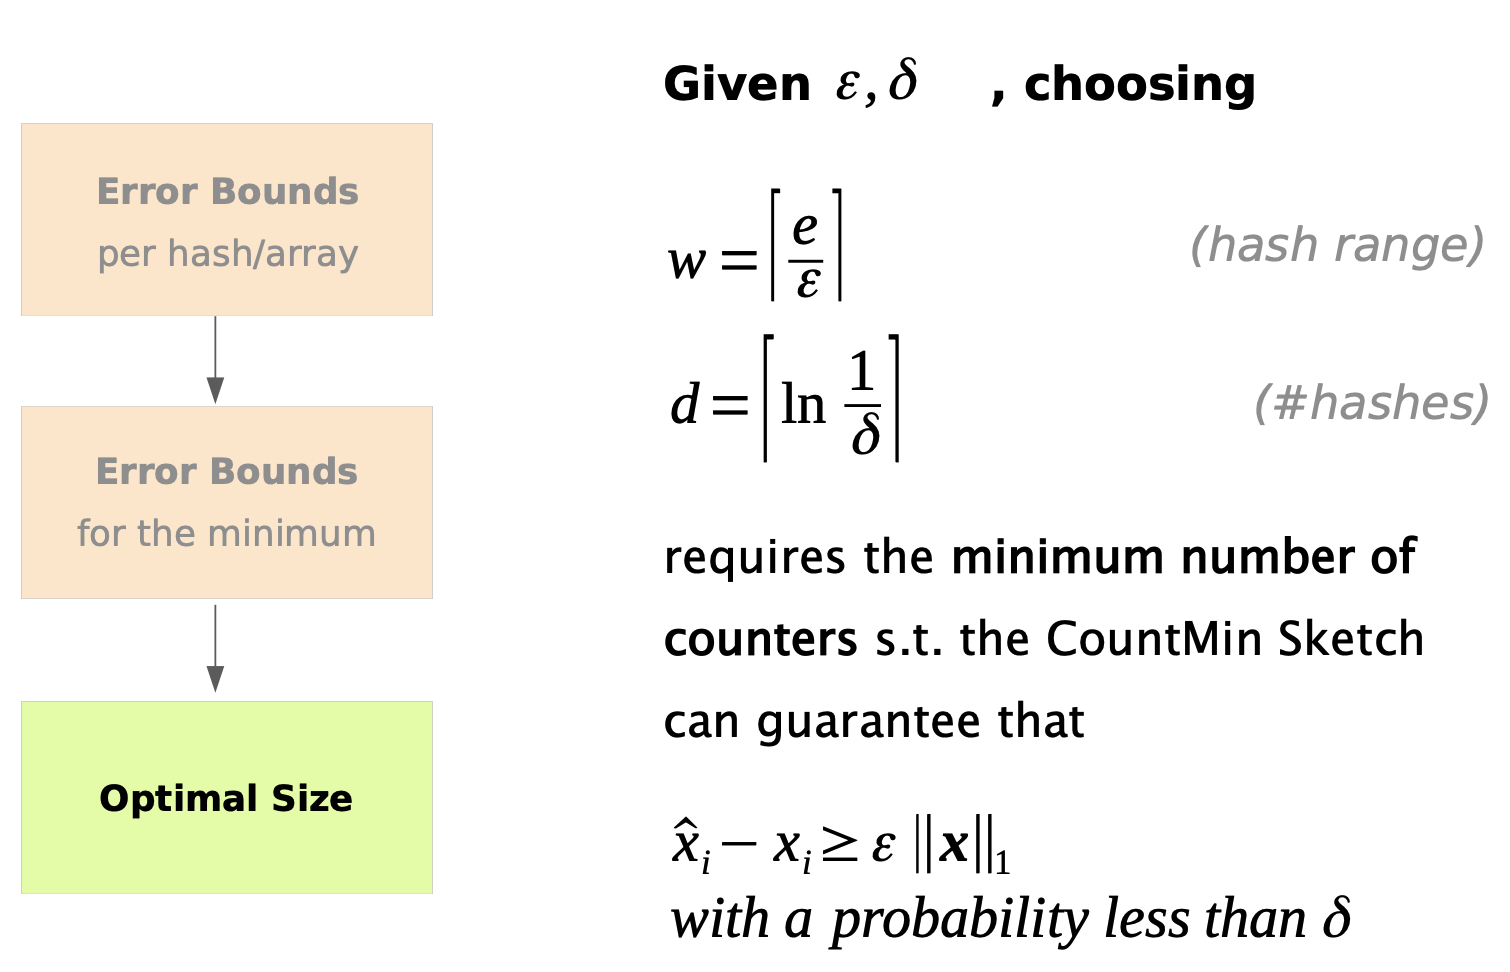
A CountMin sketch is designed to have provable L1 error bounds for frequency queries.
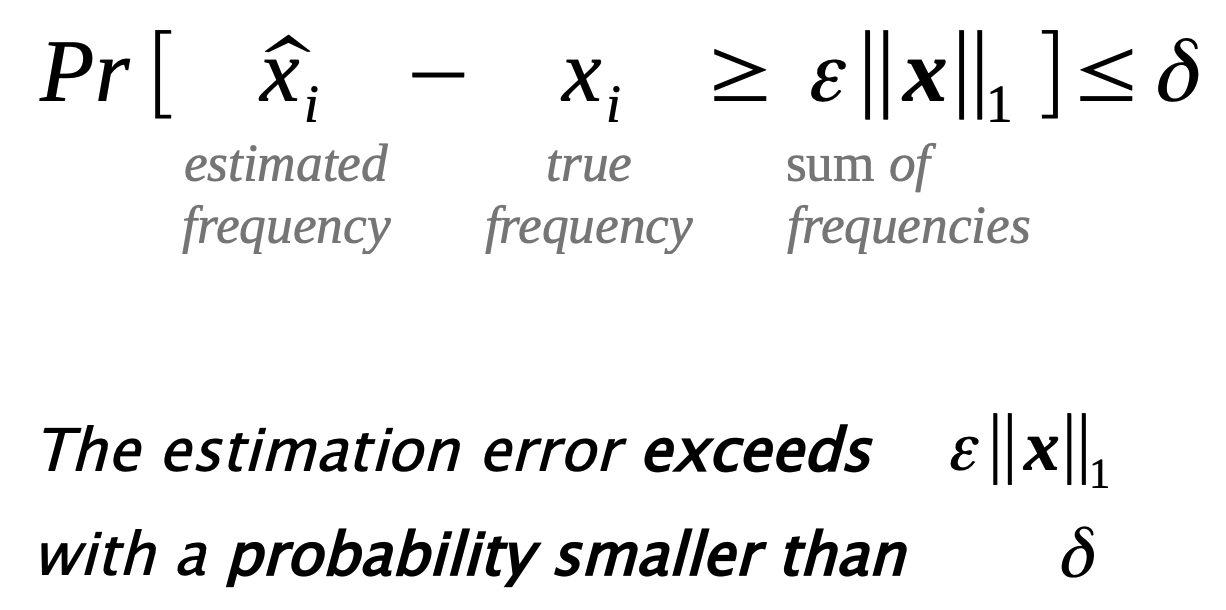 | Let $‖x‖_1 =10000 , ε= 0.01 , δ= 0.05$. Then, after counting 10 000 elements in total, the probability for any estimate to be off by more than 100 is less than 5%. |
A CountMin Sketch uses multiple arrays and hashes. 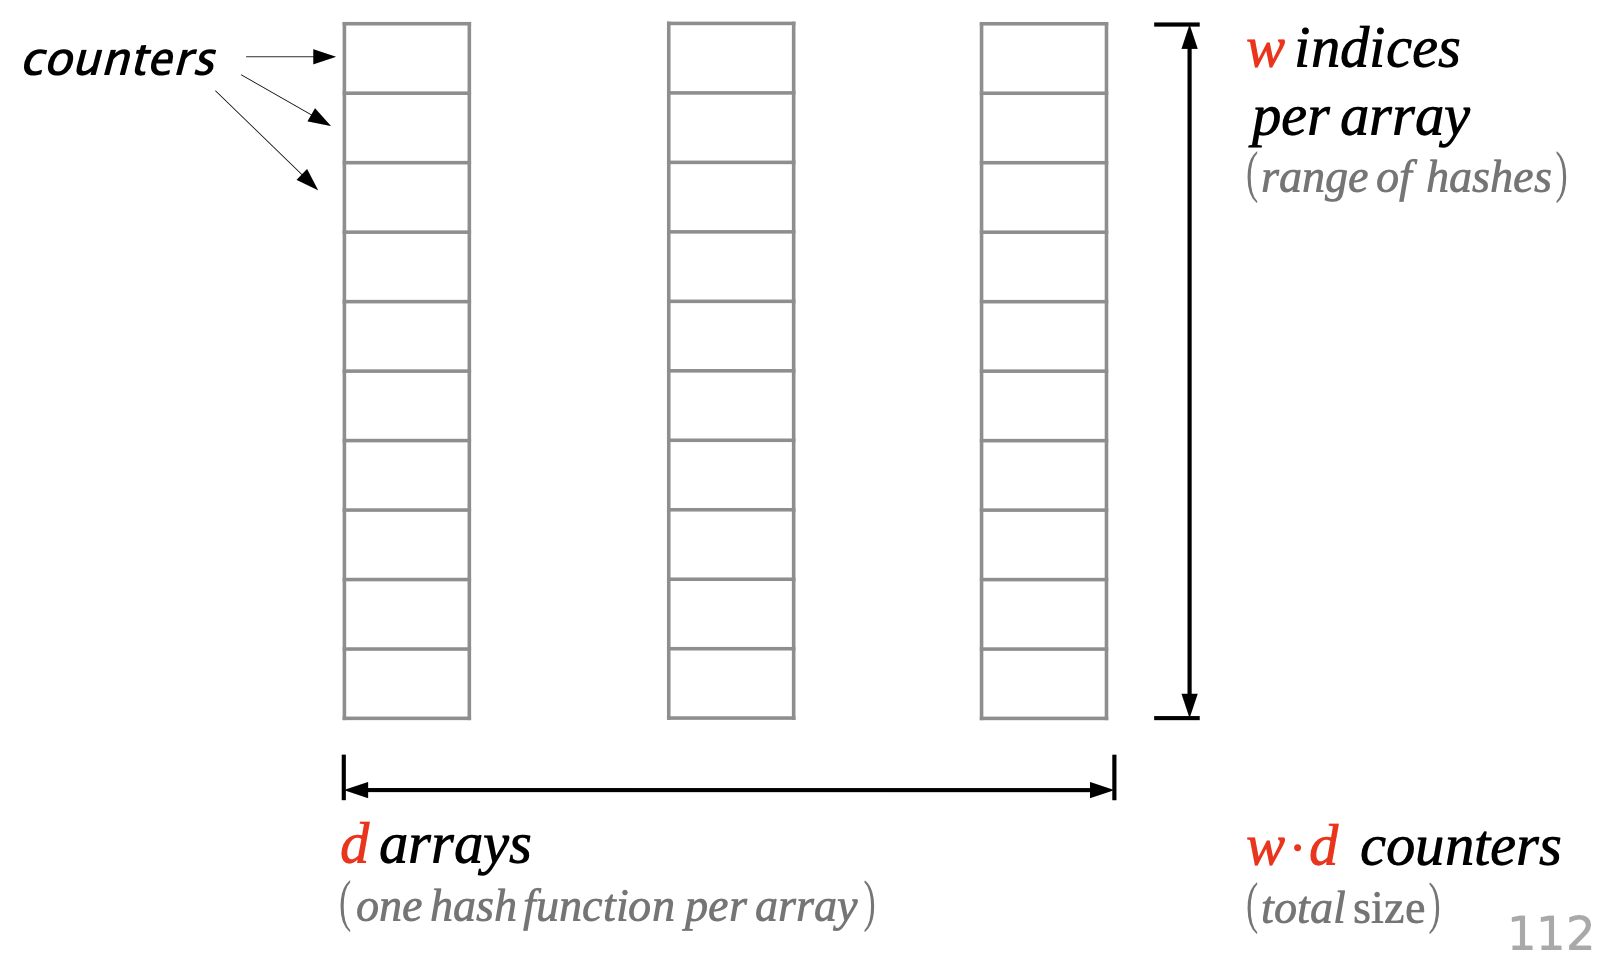
To count, increment all hash-indexed fields by 1.
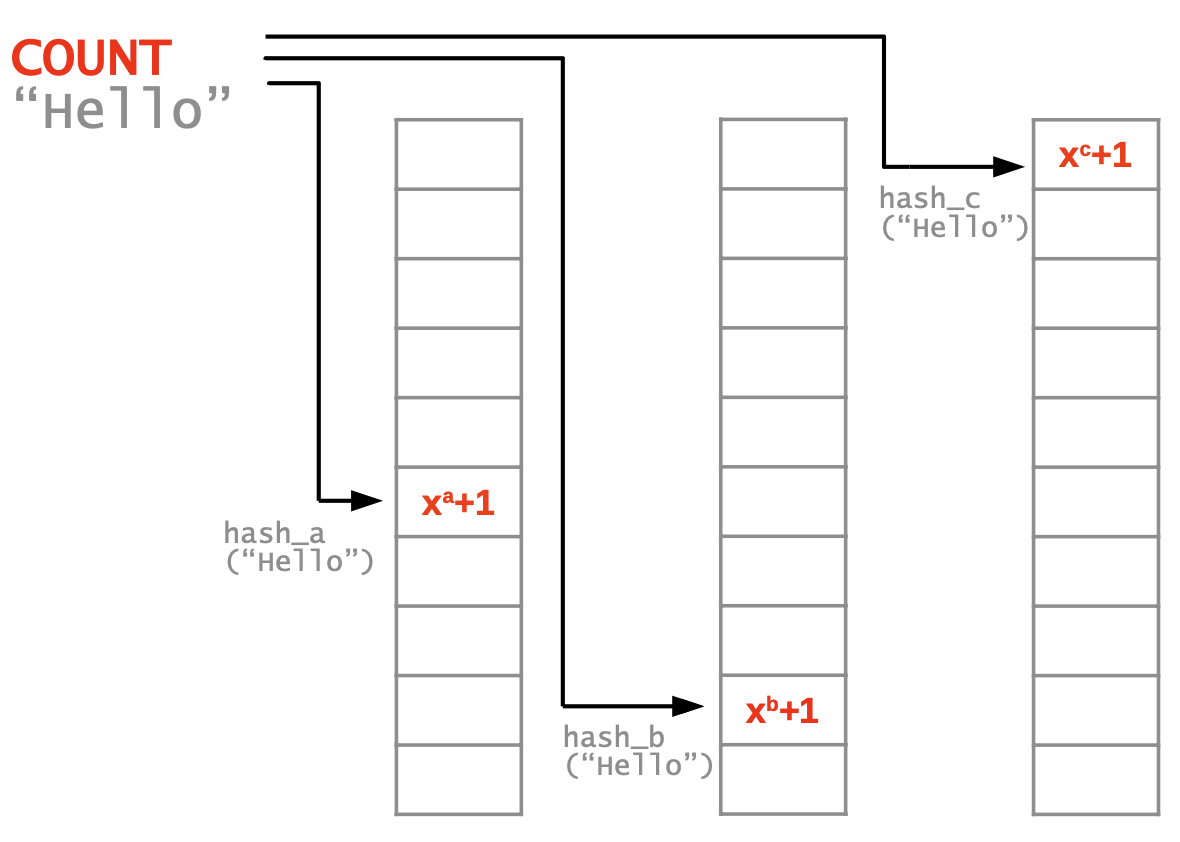
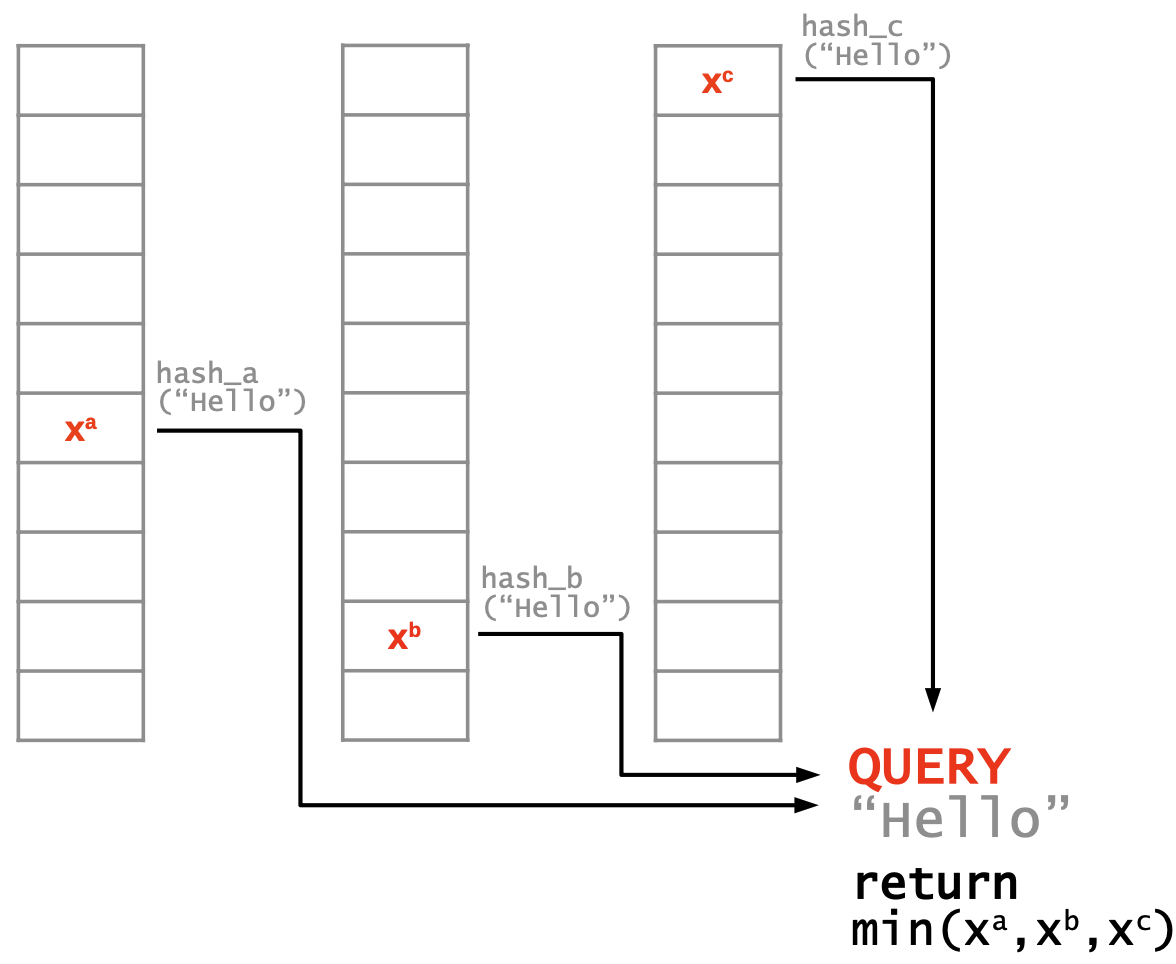
Hash collisions cause over-counting. Returning the minimum value minimizes the error.
A CountMin sketch recipe
Limitations
Sketches have limitations. They compute statistical summaries and favour elements with high frequency. 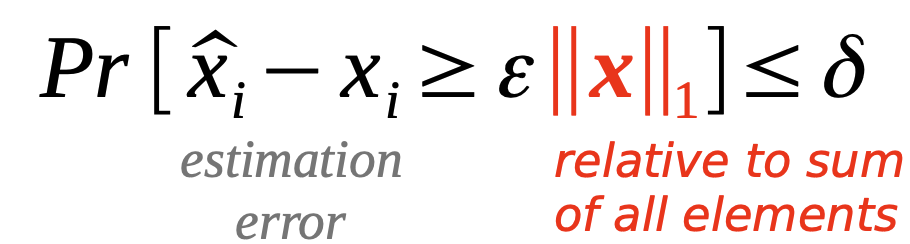
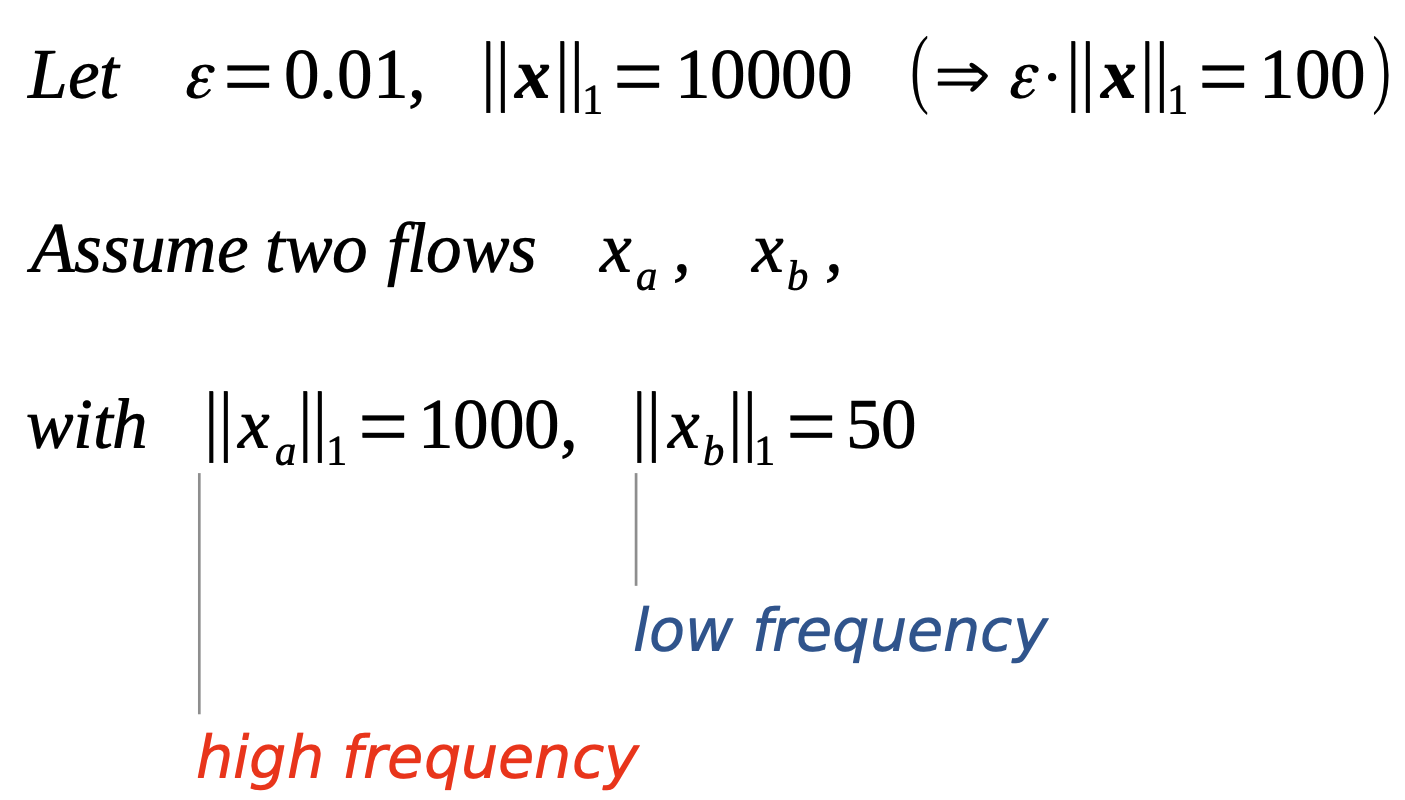
Error relative to stream size: $1\%$ flow size: $x_a: 10\%, x_b: 200\%$
Other problems a sketch can’t handle: causality, patterns, rare things.
Takeaway
Probabilistic data structures provide trade-offs between resources and error, and provable guarantees to rely on.